

M2P Fintech
Fintech is evolving every day. That's why you need our newsletter! Get the latest fintech news, views, insights, directly to your inbox every fortnight for FREE!
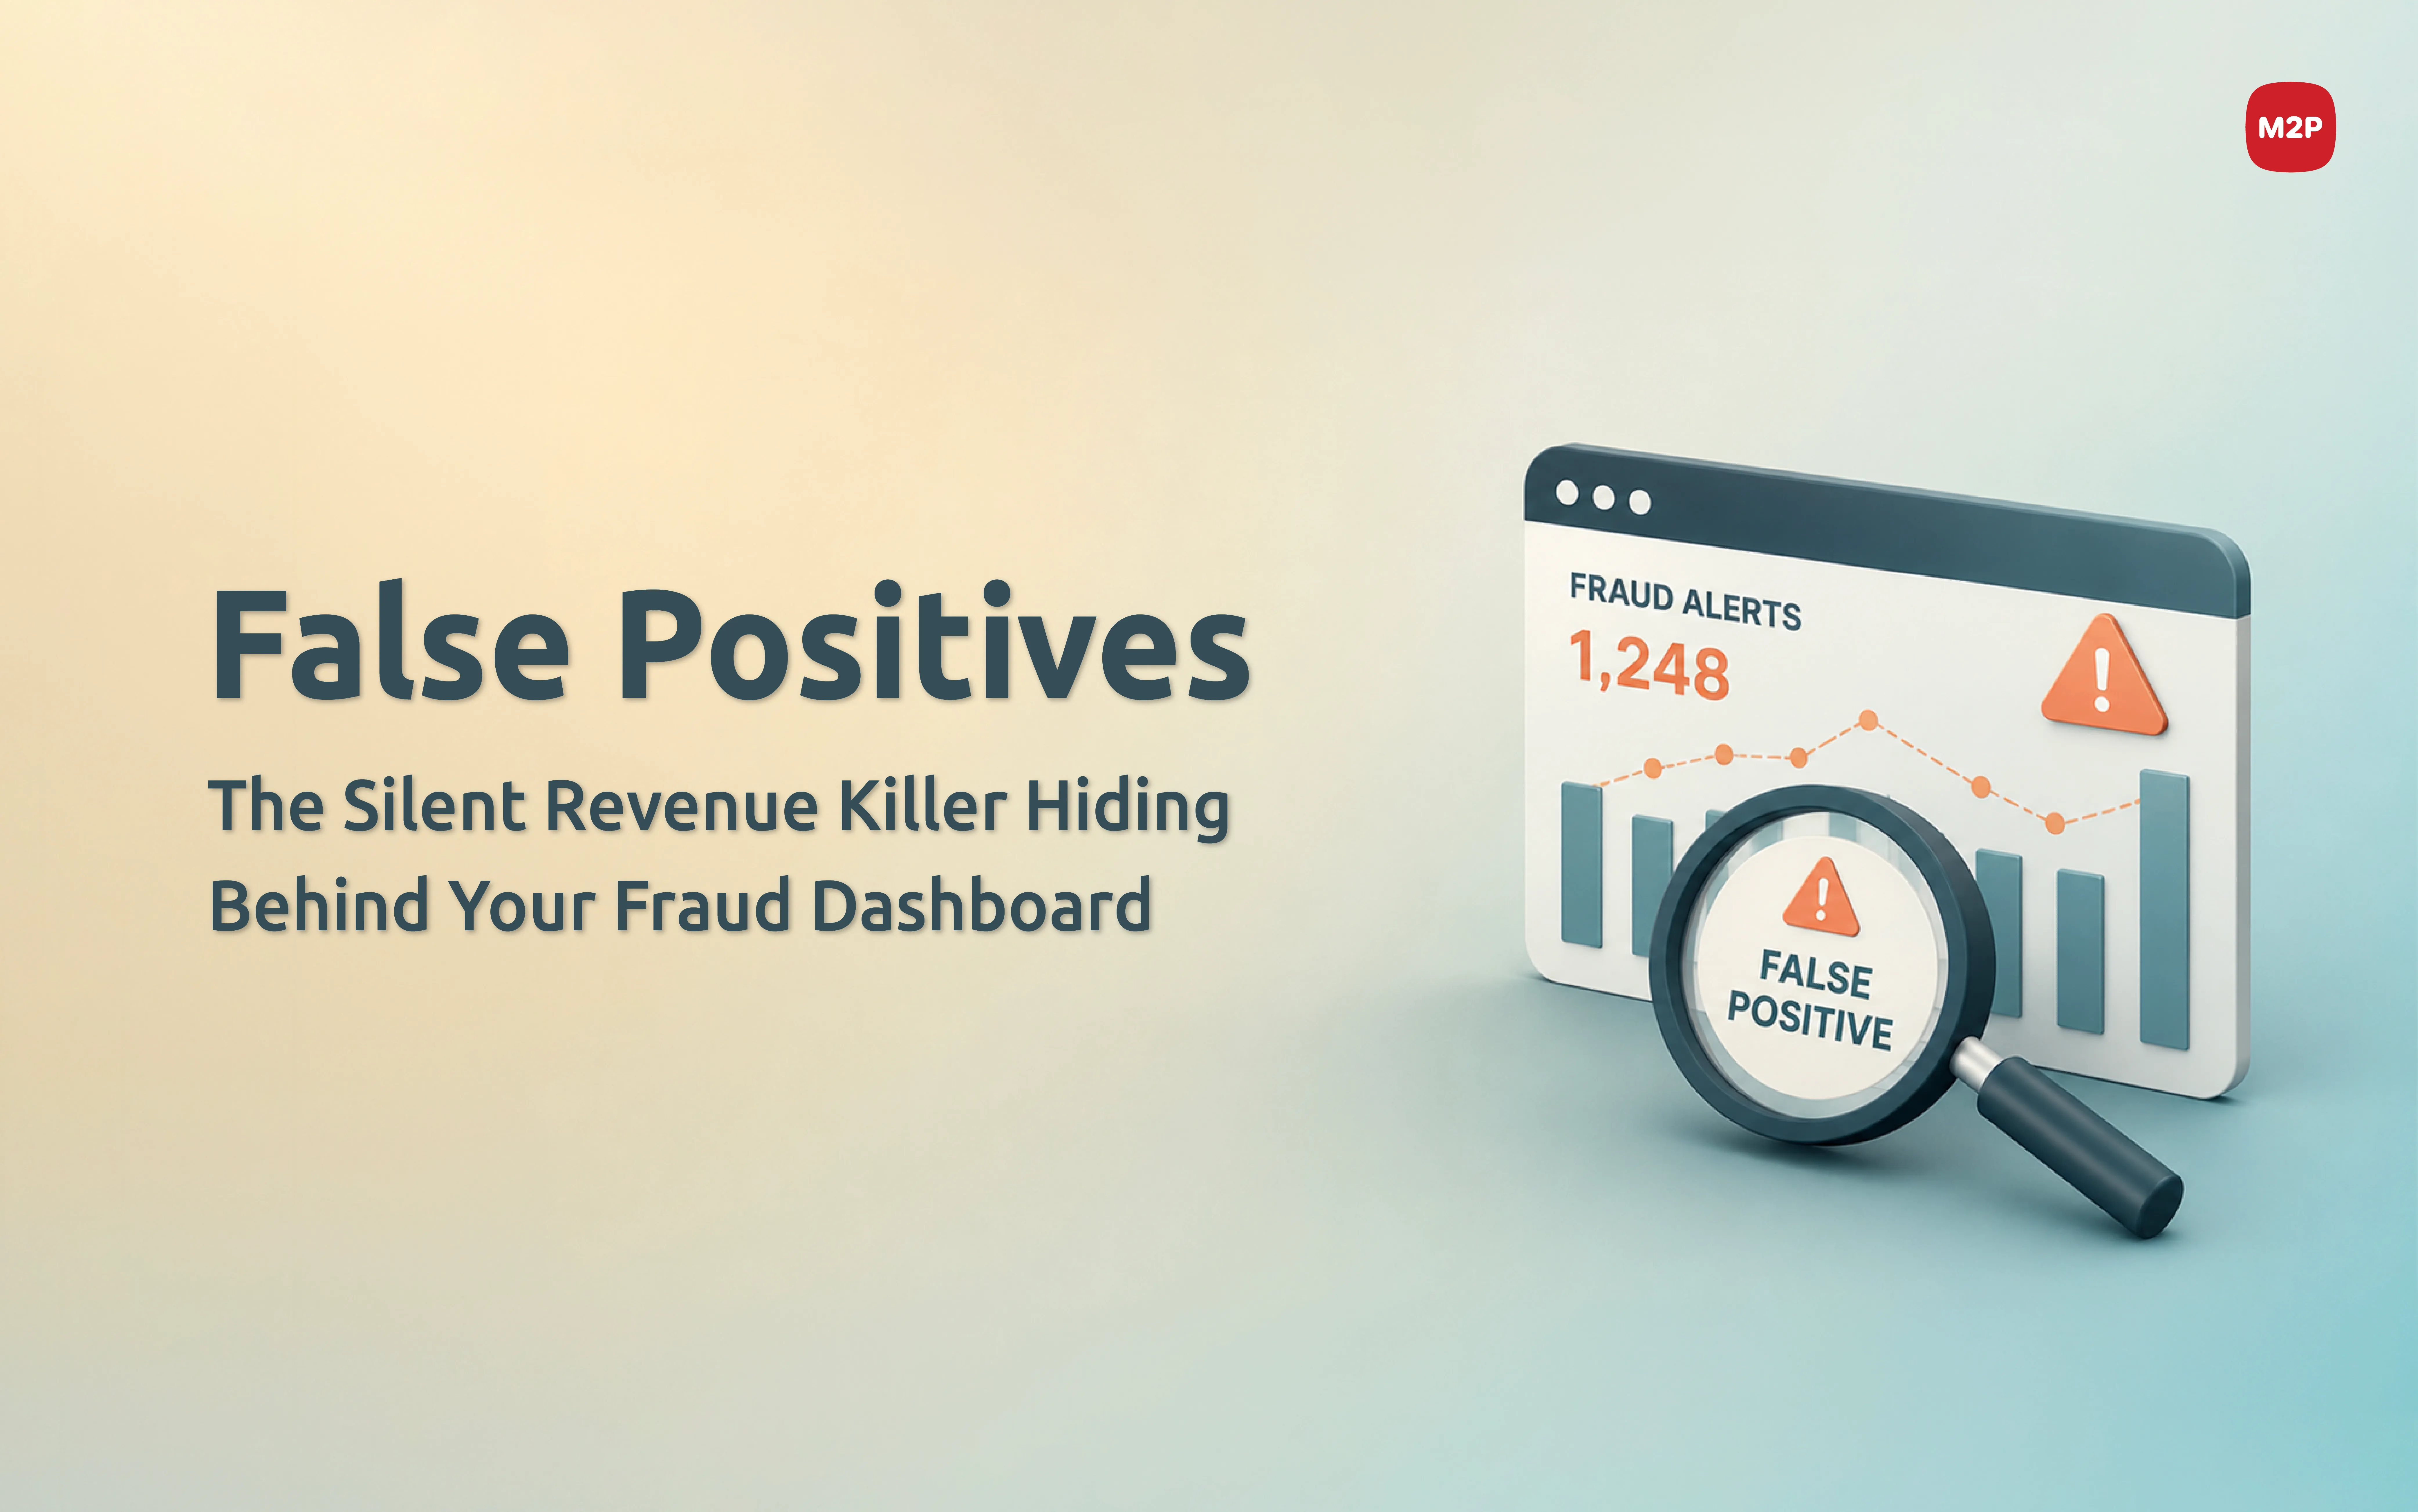
Ask any risk leader what keeps them up at night, and "fraud losses" is the obvious answer. Ask their CFO, and you'll often hear a different number entirely: declined good customers. Ask their Head of Growth, and you'll hear about cart abandonment, churn, and lifetime value walking out the door because a legitimate transaction got flagged, delayed, or blocked outright.
This is the tension at the heart of every fraud and risk management (FRM) strategy: every model that catches more fraud also risks catching more good customers in the crossfire. And most organizations are managing this tradeoff with far less rigor than they'd apply to any other line item of comparable size.
Fraud losses are visible, painful, and easy to point at. False positives are quieter — they show up as suppressed conversion rates, higher support costs, and slow customer churn that never gets attributed back to the fraud model that caused it. That asymmetry in visibility is exactly why so many risk teams over-index on blocking fraud and under-index on the silent revenue leak sitting right next to it.
This blog lays out the actual ROI math risk leaders need to run — not as an academic exercise, but as a repeatable framework you can bring into your next budget conversation, model tuning session, or board update.
In most organizations, fraud loss and false positive cost live in different reports, owned by different teams, reviewed on different cadences. The fraud team reports chargeback rates and fraud loss as a percentage of transaction value — a clean, board-friendly number that goes down when the model gets stricter. Meanwhile, the false positive cost — lost revenue from declined good orders, the support tickets from frustrated customers, the churn that follows a bad decline experience — gets absorbed into "customer experience" or "conversion" metrics that nobody connects back to the fraud model's threshold settings.
The result: fraud models get optimized against a metric that only tells half the story. A model that reduces fraud losses by 30% while tripling false declines looks like a win in the fraud dashboard and a disaster in the revenue dashboard — and because those dashboards rarely sit side by side, nobody notices until churn analysis months later traces it back.
The fix isn't complicated in principle: put both costs in the same unit (currency, not percentage points) and compare them directly. The complexity is in getting the inputs right — and that's where most organizations stumble.
The right way to think about this isn't "fraud losses" versus "false positives" as two separate line items. It's Total Cost of Fraud Decisioning (TCFD) — a single number that captures everything your fraud strategy costs the business, in both directions.
Let's break down each component, because each one is more nuanced than it first appears.
This is the number everyone already tracks: the value of transactions confirmed as fraudulent, net of any recovery. But three refinements matter:
Include chargeback fees, not just the transaction value. Card network chargeback fees ($15–$100 per case depending on the network and merchant category) and dispute-handling labor costs add up fast at volume.
Include second-order fraud losses, like mule account funds that move through your platform even when your business isn't the one directly defrauded — reputational and regulatory costs from being a conduit are real, even if they don't show up as a chargeback.
Separate fraud type. First-party fraud (friendly fraud, refund abuse) behaves differently from third-party fraud (stolen credentials, account takeover) and needs different mitigation, so lumping them into one "fraud loss" number obscures where your model is actually failing.
Every fraud case that requires manual review, every chargeback dispute that requires evidence submission, every customer service call from someone whose card got declined — these all cost real analyst and agent hours. A common mistake is measuring only the transactions that were actually fraudulent and ignoring the operational cost of investigating transactions that turned out to be legitimate. If your manual review queue processes 10,000 transactions a month and 60% resolve as legitimate, that 60% is pure operational cost with zero fraud-prevention benefit — and it's a direct function of how noisy your model's flagging is.
This is where most organizations underinvest in measurement, and it's usually the biggest number in the equation. It has two parts:
Immediate lost revenue: the value of the transaction itself, when a legitimate customer is declined and doesn't retry.
Lifetime value loss: the customer who gets declined once and doesn't come back. Industry research (from Sift, Riskified, and others) consistently finds that somewhere between 30–40% of falsely declined customers never attempt a purchase with that merchant again. If your average customer lifetime value is meaningfully larger than a single transaction — which it is for almost every subscription business, marketplace, and card-issuing program — the LTV loss from one false decline can dwarf the transaction value many times over.
Customer support costs from declined-transaction inquiries and complaints
Brand and word-of-mouth damage — a customer who feels wrongly accused of fraud doesn't just churn quietly; they tell people
Regulatory and complaint-handling costs in markets where declined transactions can trigger formal complaints to ombudsmen or regulators (increasingly relevant as regulators in the EU, UK, and parts of APAC start scrutinizing fair-treatment obligations around fraud declines)
Let's put real (illustrative) numbers against this framework for a mid-sized digital lender or card issuer processing 1 million transactions a month, with an average transaction value of $75.
Assume:
Fraud rate: 0.5% of transactions (5,000 transactions/month) are genuinely fraudulent
Current model catches 90% of fraud (4,500 caught, 500 missed)
Current false positive rate: 3% of all legitimate transactions get flagged (995,000 legitimate × 3% = ~29,850 false positives)
Average chargeback fee: $25
Average CLV of a retained customer: $600
Retry/return rate after a false decline: 65% (so 35% are lost entirely)
Direct fraud losses (missed fraud): 500 missed fraudulent transactions × $75 = $37,500/month
Chargeback/operational cost on caught fraud: 4,500 caught × $25 (dispute handling, review cost) = $112,500/month
False positive immediate revenue loss: 29,850 false positives × $75 = $2,238,750/month in transaction value initially blocked
False positive LTV loss (permanent churn from the 35% who don't return): 29,850 × 35% = 10,447 customers lost × $600 CLV = $6,268,200/month
Total monthly cost of the current model: $37,500 + $112,500 + $2,238,750 (partially recovered on retry) + $6,268,200 ≈ north of $6.4 million/month, once you account for the fact that most of the immediate transaction value is recovered on retry but the LTV loss is not.
Option A: Tighten the model to catch 98% of fraud. Missed fraud drops to 100 transactions ($7,500 direct loss) — a $30,000 improvement. But tightening thresholds to catch that extra 8% of fraud typically increases false positives disproportionately (fraud and legitimate transaction distributions overlap heavily at the margins). If false positive rate rises to 5%, that's 49,750 false positives — an increase of ~19,900, translating to roughly 4,200 additional lost customers and $2.5 million in additional LTV loss. Net effect: you spent $2.5 million to save $30,000.
Option B: Loosen the model slightly, accept catching 85% of fraud, but cut false positive rate to 1.5%. Missed fraud rises to 750 (an additional $18,750 in direct losses). False positives drop to ~14,925, saving roughly 5,200 customers and $3.1 million in LTV. Net effect: you spend $18,750 to save over $3 million.
This is obviously a simplified, illustrative model — real fraud/false-positive tradeoff curves aren't linear, and the actual shape depends heavily on your specific fraud patterns and customer base. But the exercise itself is the point: when risk leaders actually run this math, the "tighten the model" instinct is very often the wrong call, because false positive costs scale against your entire legitimate transaction base, while fraud losses only scale against the (much smaller) fraudulent share.
There's a structural reason the tighten-the-model instinct is so persistent: fraud losses are a known, bounded cost, while false positive costs are diffuse and easy to underestimate. A CFO can put a hard number on last quarter's chargeback losses. Almost nobody can put an equally hard number on "customers we silently lost because our model was too aggressive" — because that data requires deliberate instrumentation (tracking declined-then-churned customers over months, not just declined-then-retried-within-the-session) that most organizations don't build.
This creates a systematic bias: risk teams get measured and rewarded for keeping fraud loss numbers low, and false positive costs — even when they're five or ten times larger — don't show up anywhere near as clearly in the metrics that determine bonuses, budgets, and board approval.
To run this ROI math properly on an ongoing basis, risk leaders need four things in place:
1. A unified cost-per-decision dashboard. Every approve/decline/review decision should be trackable back to its eventual outcome — confirmed fraud, confirmed legitimate, or unresolved — with a dollar cost attached to each outcome type. This means integrating fraud, chargeback, customer support, and churn data into one view, not three.
2. Cohort-based false positive tracking. Don't just measure the immediate retry rate after a decline. Track the 30/60/90-day transaction and retention behavior of falsely declined customers versus a matched cohort of customers who weren't declined. That delta is your real LTV loss number, and it's almost always larger than intuition suggests.
3. Threshold testing with both costs modeled simultaneously. Every time you tune a fraud model's sensitivity, model the effect on both fraud loss and false positive cost — never just one. This sounds obvious, but in practice most model tuning conversations happen in fraud-team meetings where false positive cost isn't in the room.
4. Segmented decisioning, not one-size-fits-all thresholds. The fraud/false-positive tradeoff isn't uniform across your customer base. A first-time, low-value transaction from a new device carries very different risk economics than a repeat transaction from a known, long-tenured customer. Applying the same threshold to both wastes false-positive budget on your safest customers while under-protecting against genuinely novel risk. Segmenting your risk appetite — tighter for genuinely uncertain cases, looser for high-trust segments — is where the biggest ROI gains usually live.
This is precisely where the sophistication of your underlying fraud and risk management system matters more than raw model accuracy. A system that only outputs a binary approve/decline forces you into a blunt tradeoff. A system built for risk-tiered decisioning — approve, soft-challenge (step-up authentication, OTP, biometric confirmation), route to fast manual review, or decline — lets you shrink the false-positive cost of uncertain cases without simply waving them through.
Step-up authentication in particular is a direct lever on this ROI equation: instead of declining a borderline transaction outright (losing the customer and the sale), a well-designed FRM system can challenge it with an additional verification step. Genuine customers pass the challenge and complete their purchase; fraudsters mostly don't. This single design choice — challenge instead of decline for the genuinely ambiguous middle tier — is often the single highest-ROI change a risk team can make, because it converts a chunk of your false-positive cost directly back into retained revenue without materially increasing fraud loss.
Real-time, explainable scoring also matters here: when a risk team can see why a transaction was flagged, they can distinguish between "this looks like fraud" and "this looks unusual but is probably a legitimate edge case" — and route accordingly, rather than treating every anomaly as a fraud signal.
The next time someone proposes tightening fraud thresholds because "losses are up this quarter," the right response isn't automatic agreement — it's a question: what's the projected false positive cost of this change, in the same currency as the fraud loss we're trying to prevent?
Fraud losses and false positive costs are not two separate problems to be managed by two separate teams with two separate metrics. They are one number — the total cost of your fraud decisioning strategy — and the only way to actually optimize it is to measure both sides with equal rigor.
Organizations that get this right don't necessarily catch less fraud. They catch fraud more precisely, spend their false-positive budget on the transactions that actually deserve scrutiny, and stop quietly bleeding revenue and customer trust in the name of a chargeback number that looks good in isolation but was never the whole story.
Getting there requires an FRM system built for nuance — tiered decisioning, explainable scoring, and segmentation by risk profile — rather than a system that only knows how to say yes or no. That's the difference between a fraud strategy that protects revenue and one that quietly costs you more than the fraud it was built to stop.
 Run the Math With the Right System Behind You
Most fraud stacks weren't built to make this tradeoff visible, let alone optimize it — they were built to catch fraud, full stop, leaving false positive cost as someone else's problem to discover later.
M2P's FRM system is built around the alternative: risk-tiered decisioning that challenges the ambiguous middle instead of declining it outright, explainable scoring so your team can see why a transaction was flagged, and segmentation that lets you tighten where risk is genuinely uncertain without punishing your safest, highest-trust customers.
If you're a risk leader who's never had a clean answer to "what's our false positive cost, in the same currency as our fraud loss," reach out to M2P to see how our FRM system can help you run — and act on — that math.
Disclaimer: The figures used in the worked example above are illustrative and intended to demonstrate the framework, not benchmark data. Actual fraud rates, false positive rates, retry behavior, and CLV figures vary significantly by industry, geography, and business model — risk leaders should substitute their own measured data into this framework rather than relying on the example figures.

Fintech is evolving every day. That's why you need our newsletter! Get the latest fintech news, views, insights, directly to your inbox every fortnight for FREE!